
I worked on an analysis the top bowling pairs in Test cricket more than a decade back, but when I peruse that article today, I am struck by two things: that the ideas were very sound and have stood the test of time very well; and that the tables developed by me are tacky, dated and have not aged well - certainly understandable.
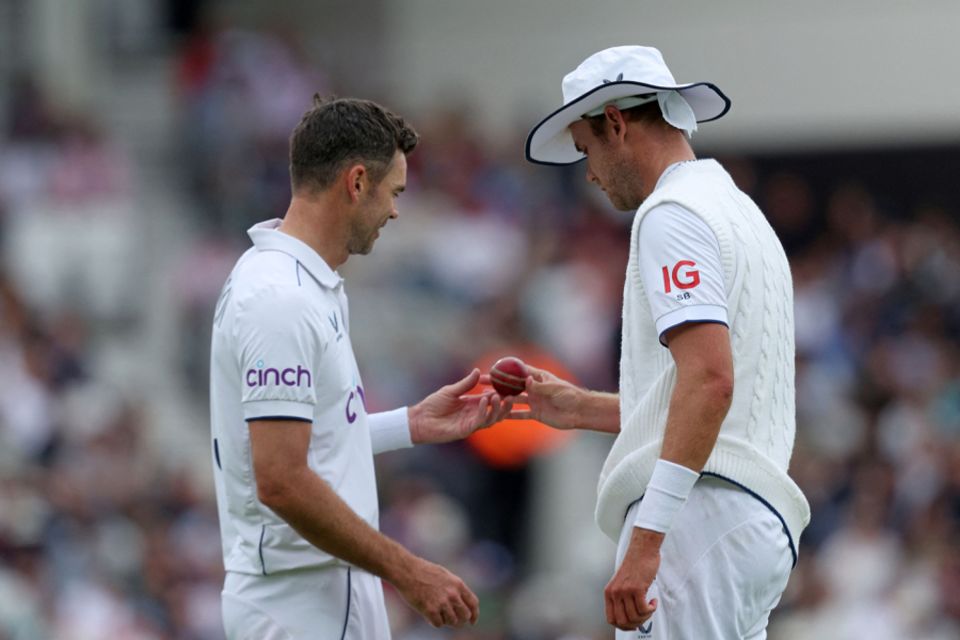
In the past decade, a few bowling pairs have blossomed and would certainly challenge those great pairs from the earlier analysis. I was certain that James and Anderson Stuart Broad, R Ashwin and Ravindra Jadeja, Dale Steyn and Vernon Philander, and Pat Cummins and Mitchell Starc etc, would challenge the earlier great pairs like Shane Warne and Glenn McGrath, Wasim Akram and Waqar Younis, Courtney Walsh and Curtly Ambrose. Hence, I embarked on a modern version of the Bowling Pairs analysis.
First, let me set down some qualifying marks: Each member of the pair has to have taken 150 Test wickets in his career; and the pair has to have played together in 30 Tests.
In a way, these two requirements complement each other: 150 wickets would normally require 30 Tests or more. And 30 Tests require anywhere between three and five years. That is a sufficiently long time for the pair to have made an impact. And it is true that the number of pairs keeps on increasing as years pass by. So there is a need to make the qualifying marks tougher. I am aware that this effectively rules out the bowlers who played before World War I. But I have to look at the overall picture.
Even with these higher bars, no fewer than 102 pairs qualify. That is indeed a fair number, certainly enough to add weight to the insights derived. A key point about these analyses is that I am only looking at pairs. As such, a bowler could be part of two or even three pairs within a single Test. For example, let us say that Mitchell Starc, Pat Cummins, and Nathan Lyon play in a Test. There are three independent pairs and each pair's numbers are computed independently. It is possible that Starc-Cummins did well while Cummins-Lyon did not do well - as pairs. This makes the whole exercise very fascinating. And readers should remember that the senior bowler is always listed first.
Another important point I would like to make is that this article is about the performance of bowling pairs. Now onwards, I will only talk about the bowling pair, not the bowler. I will not refer to the individual bowler(s) anywhere in the main article. If a pair has taken 800 wickets, I will only refer to this number and not the split of this between the two bowlers. If there are pairs in which one bowler has done the heavy lifting, so be it. At the end of the article, I have a short reference to the split. If anyone wants to get the details for all pairs, they should refer to the full data file shared at the end.
Let us move on to the tables. The first one is ordered on the wickets taken by the pair.
In the 2013 analysis, Warne-McGrath led this table with 1001 wickets. This time a new pair has moved past this legendary pair. Anderson-Broad took 1039 wickets in the 138 Tests they played. This is not a surprise considering that these two legends formed the core of England's bowling for well over 20 years.
These two are followed by Muthiah Muralidaran and Chaminda Vaas who captured 895 wickets. Then comes the current pair of Lyon-Starc, just over 100 wickets behind. Completing the top five is Walsh-Ambrose, with 762 wickets. No fewer than 16 pairs took 500 or more wickets. A number of new pairs have come in, including all those whose names I mentioned at the start of the article - the Australian combinations, a couple of South African pairs, and R Ashwin and Ravindra Jadeja.
The next table is the one ordered by the bowling average of the pair. Remember, that this is the average of the pair together.
It is not a surprise that Ashwin-Jadeja lead this table with an impressive average of 21.68. It is also a fact that Ashwin-Jadeja played most of their Tests together at home where they were deadly - nearly 600 wickets at an average that wins most of the matches. Steyn-Philander are very, very close behind. Their average is 21.71, just 0.03 more.
Joel Garner and Malcolm Marshall are just a hundredth of a decimal behind. Allan Donald and Shaun Pollock are in fourth place while another West Indian pair, Michael Holding and Garner, are at a sub-22 level. In reality, the top ten in this table is stuffed with the West Indian pairs - six in all.
At the other end of the table, Daniel Vettori and Chris Martin bought their wickets like millionaires. Their average was well above 36. Two Indian pairs complete the bottom three. Kapil Dev and Ravi Shastri from yonder years and the more recent pair of Harbhajan Singh and Ishant Sharma.
Now, on to the strike rate of the pairs.
If I had been asked before I started my work as to which pair would have been at the top of the strike-rate table, I would have said Starc-Cummins and that would have been correct. We have all seen the way they bowl in tandem. That combination of left-arm swing at pace and the right-arm pace variety is indeed deadly. Steyn-Philander have again missed out on the first place by the proverbial whisker. They took an extra half delivery to take a wicket.
For those who are wondering where the famous duo of Wasim Akram-Waqar Younis is, they are third in this table - again, only 0.3 ball(s) away. The pace duo of Starc and Josh Hazlewood are in fourth place. Completing the top five is the South African pace duo of Makhaya Ntini and Steyn. Look at the understandable presence of only a pair of spinners in the top ten pairs: Jadeja, maybe profiting by the deadly striking ability of the wizard Jasprit Bumrah, and Keshav Maharaj.
Well, most of the spinners are there at the bottom of the table. S Venkataraghavan and Bishan Bedi needed all of 15 overs to get a wicket. They were indeed patient and waited for their wickets. The West Indies spinners pair of Garry Sobers and Lance Gibbs needed nearly as many balls to get a wicket. Completing the bottom three is the Indian pair of Kapil-Shastri.
Let us now move on to the bowling accuracy of the pairs.
As a pair, Richie Benaud and Alan Davidson conceded only 2.0 runs per over. This is partly due to the fact that Davidson was very accurate despite being a medium-pace bowler. Many spinners are in the top ten, either as pairs or in collaboration with pacers. At the other end of the table we have, as expected, pace-bowling pairs who conceded nearly 3.5 runs per over.
The next table lists the pairs by the percentage of team wickets they took in the matches they played together.
Murali-Vaas captured just over 59% of the Sri Lankan wickets in the 95 matches they played together. I suggest that the readers just roll these numbers around their head - two bowlers with nearly 60% of the wickets. Bhagwath Chandrasekhar and Bedi also took nearly 59% of the team wickets in the 42 Tests they played together. Another Indian pair, Anil Kumble and Harbhajan, follow next with 57.5%. Then come Akram-Waqar. Completing the top five is the recent pair of Ashwin-Jadeja. All these are subcontinental pairs.
At the other end of the table, we have Anderson and Ben Stokes, Chris Woakes and Stokes, and Jacques Kallis and Morne Morkel.
Wickets per Test is an important delivery measure for bowlers, and bowling pairs. Only one pair in history, Ashwin-Jadeja, has taken over ten wickets per Test when they played together. As already said, mostly in India. Warne-McGrath finished at just below the ten-wicket mark. Then come Murali-Vaas. At the other end of the table we have the pairs with one fourth/fifth bowler, with an average of five wickets per Test.
Recommended Read


Which pairs were the most successful ones in terms of wins achieved for their teams?
The combination of McGrath and Brett Lee bowled together in 45 Tests and finished on the winning side 36 times - that's an 80% winning record. That is truly amazing. Lee continued in this vein in his partnership with Warne. They were together in 45 Tests and won 35. Let us not forget that most of these Tests would be common between these two pairs. And the third pair, Warne-McGrath were fifth - 71 out of 104 (just over 68%). Sandwiched in the middle are two Indian pairs. Surprisingly, Umesh Yadav-Jadeja, and, not so surprisingly, Ashwin-Jadeja. They won either side of 70%.
Venkat-Bedi won only a sixth of their Tests. And finally, Kapil-Shastri - well, they won only one in around eight Tests. Those were the days of drawn Tests.
Now, I move on to three tables in which I compare the performances of the pair and the team. This comparison is important since the ratios clearly indicate how the pairs performed in relation to their compatriots in the specific range of Tests. The first is a comparison of the bowling averages of the pair of bowlers with the other bowlers. This comparison is done at the macro level. Taking each Test the pair played, I accumulate the numbers of the concerned pair on one side and the other bowlers who bowled on the other side. At the end, I determine the bowling averages and determine a ratio for each pair. This table is ordered on the ratio. Care is taken that only the bowler-related dismissals are included, so that it is a true comparison.
Murali-Vaas were terrific and averaged just over 24. Their compatriots were extravagant to a fault and conceded nearly 40 runs per wicket. That is over 164%. This is clearly understandable, considering that they were ahead of their compatriots by a mile. Chandrasekhar-Bedi themselves were somewhat extravagant and averaged nearly 28. But the other bowlers were millionaires, so to speak, and averaged nearly 42, with a ratio of around 150%. Then comes Steyn-Philander, with a ratio of 1.48.
The top five are completed by Akram-Waqar, who averaged just over 22. Their compatriots were not ineffective but still averaged nearly 33. Then a different Pakistani combination, Imran Khan and Akram. At the other end, we have two Australian pairs with ratios around 0.9. This is clearly due to the presence of four top-quality bowlers in the same team for a fair length of time.
The strike-rate comparison between the pairs and their compatriots is done in a similar manner - looking at all the Tests played by the pair of bowlers. The Roses combination of Brian Statham and Fred Trueman lead the table with a ratio of 1.39. They complemented each other beautifully and were devastating, especially at home. Akram-Waqar follow next. This is quite understandable since Waqar, with his individual sub-44-balls strike rate, is in the top seven of qualifying bowlers. And Akram was no slouch. They needed fewer than 46 balls per wicket. They are followed by Andy Caddick and Darren Gough. Ntini-Steyn were nearly as good and had nearly the same ratio. Bob Willis and Ian Botham complete the top five. At the other end of the table we have the Indian pair of Jadeja and Mohammed Shami, followed by Sobers-Gibbs and Peter Siddle and Lyon. All are around 0.85.
The win percentage comparison is a totally different measure altogether. A win is a binary result of each Test played by the pair. There is no comparison possible within the Test; the comparisons have to be across a different range of Tests altogether. So I have selected the range of Tests, taking a logical route. For comparison, I have looked at the wider career ranges of the two players. I consider all matches between the first and last Tests played by the pair. The first Test is straightforward - the first Test of the senior bowler of the pair. The last Test is not that straightforward. The careers could have encompassed each other's or overlapped. So I take the latter Test of the two last Tests of the pair of bowlers. A pair of examples will explain this.
Anderson's range of Tests is between match numbers 1646-2538. Broad's is 1853-2515. That means Broad's career was contained within Anderson's. So here the range of Tests considered is 1646 to 2538.
Akram's career was between Tests 1010 and 1584. Waqar's was between 1127 and 1637. So their careers were overlapping. So here the range of Tests is from 1010 to 1637.
The team's win per cent during the broader range of Tests is compared to the win per cent within the pair's range of Tests and a ratio determined. An important point is that the pair's Tests are excluded from the wider range. This is so that the comparisons become truly "pair vs rest".
It is possibly a surprise that Sobers-Gibbs were far more successful than their compatriots by a factor of over 2.5. This pair is followed by Gibbs and Wes Hall. And then by Sobers-Hall. This triple positioning means certainly that most of these Tests are all overlapping ones with all three playing together. Then come Tim Southee and Trent Boult, seemingly from nowhere. Then we go back many years to Keith Miller and Bill Johnston. None of the top pairs are in the top ten. At the other end, we have Lindwall-Benaud, who achieved only 60% of the wins of those by their compatriots. Then comes Anderson and Monty Panesar and finally the pair of Kapil-Shastri. These have appeared regularly at the lower end of the tables.
Just a final nugget on the share between the two bowlers within a pair. As I have already mentioned, this is the only time I will separate the bowlers within a pair. Among the 102 pairs, only one pair had the two bowlers taking the same number of wickets. The Chandrasekhar-Bedi pair captured 368 wickets - each capturing 184 wickets. Walsh and Ian Bishop together captured 297 wickets - Walsh dismissed 148 and Bishop, 149.
Coming to the other end, Kallis-Steyn took 424 wickets as a pair with Steyn capturing 335 wickets (nearly 80%). This is almost the same case with three other pairs in which Kallis has played, with Kallis being the junior partner, by the proverbial mile. And just for information, the maximum number of balls was bowled by Anderson-Broad. When playing together, they sent down no fewer than 58,329 deliveries. Some distance behind are Warne-McGrath, who sent down 53,272 deliveries. In third place is the pair of Murali-Vaas, with 52,086 deliveries.
The complete data for the 102 pairs can be perused and analysed by anyone by downloading this Excel file.
Finally, a quirky table. I got this idea at 4am. I wondered how these bowling pairs would have fared in batting. Yes, there are batters (Sobers), there are allrounders (Miller) and there are bowlers who could bat very well (Ashwin). But there are also No. 12 batters around (Chandrasekhar). So I did the work, more for myself, and then decided to share this nugget with the readers. This table lists the bowling pairs in the order of the runs per Test, but it's their batting runs this time.
As expected, the batter-driven pairs are at the top. We would suspect that Sobers would have scored most of the runs in his pairing with Hall. As would Kallis. But Chris Woakes will have scored nearly as well as Stokes. The table is propped up by two No. 11 batters - Chandrasekhar and Bedi. Then comes another pair of No. 11s - Anderson and Panesar. Five of the pairs aggregated fewer than 20 runs per Test.
Potpourri
This time the potpourri relates to the subject article. I have presented the bowling pairs who took all 20 wickets in a Test. Surprisingly, in 150 years of Tests, only seven pairs have achieved it. Obviously the most amazing one is the Jim Laker and Tony Lock clean-up in the 1956 Old Trafford Ashes Test. Laker took 19 wickets and Lock the 20th. The most recent achievement was a couple of years back, over half a century after the previous one, driven by Bob Massie. It is interesting to note that three of the seven Tests were played before the First World War.
Talking Cricket Group
Any reader who wishes to join my general-purpose cricket-ideas-exchange group of this name can email me a request for inclusion, providing their name, place of residence, and what they do.
Any reader who wishes to join my general-purpose cricket-ideas-exchange group of this name can email me a request for inclusion, providing their name, place of residence, and what they do.
Email me your comments and I will respond. This email id is to be used only for sending in comments. Please note that readers whose emails are derogatory will be permanently blocked from sending in any feedback in future.